What are the price patterns?
A price pattern is a pattern that arises from price movements that occur in the forex and commodity markets where certain patterns will reappear.
In forex and commodity trading, the term "history repeats itself" is known, which means history repeats itself. By studying and recognizing price patterns, you can predict the next price movement when a pattern appears.
Basically, there are two types of patterns, namely reversal patterns and continuation patterns.
A continuation pattern is a pattern that gives an indication that the price will tend to continue its movement in accordance with the previous trend.
For example, if this pattern appears during an uptrend, after this pattern is confirmed, the price tends to move up to continue the uptrend.
Likewise, if this pattern appears during a downtrend, then the price will tend to go down to continue the downtrend.
The Complete Reversal Pattern Guide
Definition of a Reversal Pattern
A reversal pattern is a pattern that indicates there will be a trend reversal. If during an uptrend or downtrend, this pattern appears, it is estimated that the price will move against the direction of the previous trend.
Double Top and Double Bottom Patterns
Understand the Difference Between the Double Top and Double Bottom Patterns
You will understand the word "top" as a peak and the word "bottom" as a valley. Thus, "double top" means two peaks. While the double bottom means two valleys,
The double top and double bottom patterns do look like two peaks and two valleys side by side. Both patterns are quite easy to recognize and have fairly high accuracy.
Double Top
The picture above is an illustration of the double top pattern. This pattern usually appears at the end of an uptrend and has bearish implications. Notice that there are six dots marked in the figure. You can say that there is the potential for a double top pattern to form if the price has moved down from point (3).
Remember, new potential.
When point (4) breaks, then you can say that the double top pattern has been formed. In other words, confirmed Also note that the confirmation of this double top is actually a breakdown of the base line.
If the pattern is confirmed, then the next price movement is potentially bearish. The arrow image shows the potential for the bearish potential that may occur. The distance that the price movement may travel is as far as the peak level to the base.
So, if, for example, the distance between the peak level and the base is 100 pips, then the price will potentially drop 100 pips after the base is broken. However, there are times when the pullback will occur again to the base area before the target of the bearish movement is reached.
Usually, a pullback will potentially occur when the price is "halfway" towards the target. If the target of the movement is 100 pips, then usually a pullback will have the potential to occur when the price has fallen about 50-60 pips after the base breaks.
However, if the pullback that occurs "goes too far" until it breaks again above the base, then this pattern is said to be invalid or failed.
Double Bottom
A double bottom is simply the opposite of a double top. This pattern usually appears at the end of a downtrend and has bullish indications. When the base breaks and this pattern is confirmed, the price is potentially bullish.
The way to estimate the target for the bullish movement is exactly the same as the double top, only the direction is upwards. A double bottom is said to fail if the pullback that occurs continues until it breaks back below the base.
Tri-Top & Triple Bottom Pattern
Understand the Triple Top and Triple Bottom Patterns
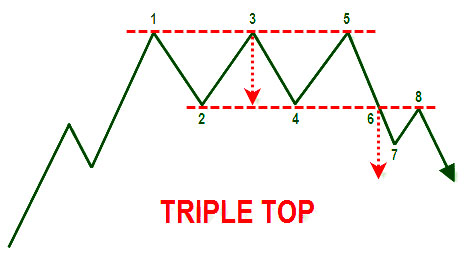
These two patterns are actually not much different from the double top and double bottom. However, the triple top has three peaks, and the triple bottom has three valleys.
The way to recognize the confirmation is the same, namely the translucent of the base line. Likewise, how to estimate the target movement after the pattern is confirmed is not.
Below is an illustration of the triple top and triple bottom.
Tri-Top Pattern
Note: the three troughs or peaks don't have to be at the exact same level, but the differences shouldn't be too significant either.
In other words, at a glance, the three valley points look level. Likewise, for the double top and double bottom patterns, the peak and valley levels do not have to be exactly the same.
Don't be mistaken, this is the difference between head and shoulders and inverse head and shoulders.
The Difference Between Head and Shoulders and Inverse Head and Shoulders
This pattern is also a reversal pattern that is quite popular because of its high accuracy. It is called "head and shoulders" because the shape of the pattern seems to form the head and shoulders.
Sometimes this pattern is misperceived as a triple top or triple bottom, but there are key factors that distinguish this pattern from a triple top or triple bottom.
Head and Shoulders Pattern
Let's look at the basic head and shoulders pattern below:
If you look closely, you can see that point (3) of this pattern is higher than points (1) and (5). In the triple top pattern, these three points tend to be level. The higher peak is the head, while the points (1) and (5) are the shoulders.
This head and shoulders pattern becomes a bearish reversal pattern if it appears at the end of an uptrend. The confirmation is when the neckline is broken (6th point).
If this pattern is confirmed, the price will likely move down as far as the distance from the top of the head to the neckline. In the image above, it is represented by a red arrow.
Pullbacks also often (though not always) occur back to the neckline area before the price moves back down to reach the target price movement. This pattern is said to fail if the pullback occurs until it breaks above the neckline.
Inverse Head and Shoulders
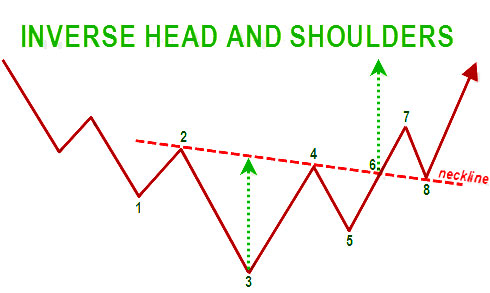
The inverse of the head and shoulders pattern is the head and shoulders pattern. This pattern is a bullish reversal pattern that usually appears at the end of a downtrend. The confirmation is exactly the same as the head and shoulders.
If this pattern is confirmed, the price will likely move up as far as the distance from the top of the head to the neckline. The image below will help to explain the inverse head and shoulders pattern:
Types of Triangles
What Types of Triangles Should You Know?
From the name, you may already be able to guess the shape of this pattern.
Yes, this pattern does have a shape similar to a triangle. This pattern occurs because the market is moving sideways and the fight between bulls and bears is balanced.
So, finally, the price movement chart condenses and forms a triangle. There are three types of triangles:
- Symmetrical triangle
- Ascending triangle
- Descending triangle
We will discuss them one by one, starting with the symmetrical triangle.
How to Use Symmetrical Triangles
Understand the Use of Symmetrical Triangles
Although the meaning is a symmetrical triangle, in reality, the shape is not always symmetrical. A symmetrical triangle is a triangle pattern that has a converging line of support (lower line) and resistance (upper line).
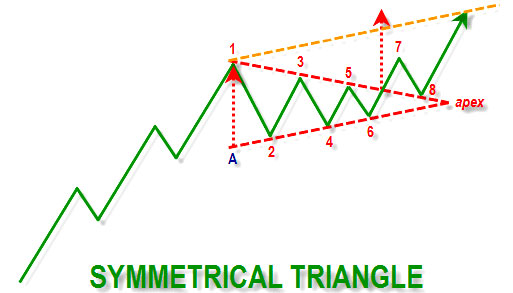
To make it easier to understand, let's look at the image below:
From the picture above, you can see that this pattern is formed when the market is moving sideways after experiencing a bullish rally. The term is consolidation.
The example above shows a symmetrical triangle that is formed during an uptrend. A symmetrical triangle must have at least four reversal points (reversal points), consisting of two high points and two valley points.
The picture above shows a symmetrical triangle which has six reversal points, namely points 1, 2, 3, 4, 5, and 6. A break of the upper line would confirm this pattern. When this pattern is confirmed, the next movement is up.
The way to estimate the target is to rely on the baseline of the symmetrical triangle, which is the distance from A to point 1. So, for example, if the baseline is 100 pips long, then the next move is also expected to be 100 pips.
Another way that can be used to estimate the target movement is to draw a line parallel to the lower line, where the line starts from point 1.
As with other patterns, a pullback is possible. In the picture above, it can be seen that the pullback occurred from point 7 back to point 8, which is in the upper line area. If you look again, the upper line and lower line meet at one point.
We call this point the apex.
You need to pay attention to the apex because a break of the upper line, which is the confirmation of the symmetrical triangle pattern, should not be too close to the apex. As a general rule, the price should have broken the upper line at a distance of approximately 2/3 (two-thirds) to three-quarters of the pattern length.
The length of the pattern in question is the distance from the baseline to the apex.
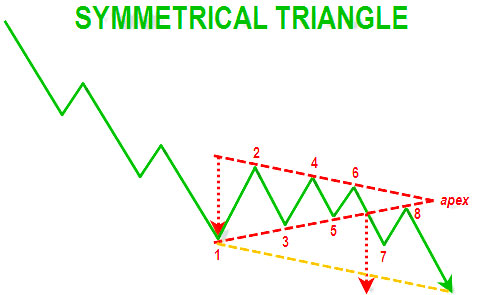
So, if the break is less than 2/3 or more than the length of the pattern, it is most likely invalid. In addition to occurring during an uptrend, the symmetrical triangle can also occur during a downtrend.
It's actually the same, it's just that the position is at the bottom.
If in the example above you were waiting for a break of the upper line as confirmation and the price is likely to move up, then if the pattern occurs during a downtrend, you will wait for the lower line to break and the price will likely move down.
That's the only difference.
Application of the Ascending Triangle Pattern
Ascending Triangle Pattern.
Basically, the ascending triangle is not much different from the symmetrical triangle in terms of analyzing it. The difference between the two patterns is only in their shape. The ascending triangle is a continuation pattern that usually appears during an uptrend.
The appearance of this pattern is a sign that the bullish pressure is gradually exceeding the bearish pressure.
Like the symmetrical triangle, the ascending triangle pattern must have at least four reversal points. The picture above shows an ascending triangle which has six reversal points.
The confirmation of the pattern is a break of the upper line, which then has the potential to be followed by a bullish move. The method of estimating the target price movement is also similar to the symmetrical triangle, only the baseline is not based on point 1, but is based on point 2.
Although the basic ascending triangle is a continuation pattern, it can also be a reversal pattern if it occurs during a downtrend. A break of the upper line is a confirmation that the ascending triangle is a reversal pattern.
Take a look at the following pictures to make it easier for you to understand:
This pattern is popularly known as the "ascending triangle bottom."
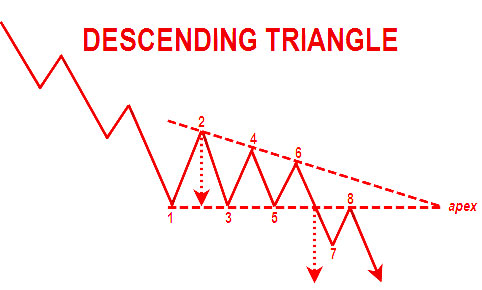
Descending Triangle Pattern Explanation:
A Descending Triangle Pattern
We have already talked about the symmetrical triangle and the ascending triangle.
It looks like you will have no more trouble understanding the 3rd type of triangle, which is the descending triangle. Simply put, the descending triangle is the opposite of the ascending triangle.
Thus, if the ascending triangle is a bullish pattern, then the descending triangle is a bearish pattern. The descending triangle is a continuation pattern that appears during a downtrend.
How simple, right?
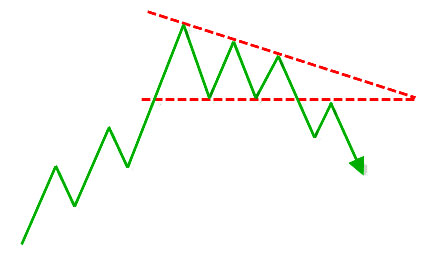
The descending triangle can also turn into a reversal pattern if it appears during an uptrend. Its name has been modified to reflect a descending triangle top. So the story will be like in the image below:
Introduction of the Flag & Pennant
Do You Know What a Flag and a Pennant Are?
Flags
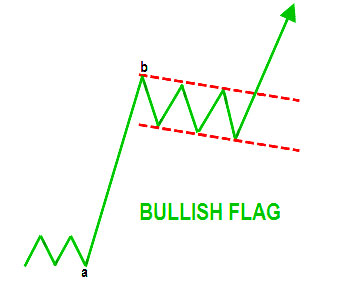
We'll talk about flags first. The flag is actually a small channel that appears after the rally. The direction of the channel is opposite to the direction of the rally.
So, if there is a small down channel that appears after a bullish rally, it is called a "bullish flag." On the other hand, a small up channel that appears after a bearish rally is called a bearish flag.
Let's look at the following image:
Yes, that's the basic form of a flag.
Now that you know, why is this pattern called a flag?
because the shape is similar to the flag (flag) and the pole (flagpole).
The flag is represented by a small channel while the flagpole is the point a to b seen in the image above. In a bearish flag, a break of the lower line of the up channel is the confirmation.
The price tends to move down if the bearish flag is confirmed. On the other hand, on a bullish flag, the confirmation is a break of the upper line from the down channel.
The next projected price movement is bullish if the bullish flag has been confirmed. The method of determining the target price movement is also simple. You simply measure the length of the flagpole only.
Along the flagpole, that is the distance possible for the price movement to travel. For example, if the length of the flagpole is 100 pips, then the price is likely to move as far as 100 pips after the flag pattern is confirmed.
But in practice, most traders stop (close positions) after the price moves "halfway" before reaching the target. For example, if the target is 100 pips away, then they tend to stop at 50–60 pips.
The general conditions for flags are as follows:
There was a rally before the small channel was formed.
The channel in which the direction occurs must be the opposite to the direction of the previous rally.
The length of the channel (flag) is at least one-third the length of the flagpole.
Penannt
OK, we're going to talk about pennants now. The pennant is basically a development of the symmetrical triangle pattern. However, the pennant was preceded by a long and quite steep rally.
It can be said that the pennant is the result of a cross between a symmetrical triangle and a flag. Because the pennant is similar to the symmetrical triangle and flag, the rules that apply to the symmetrical triangle and flag also apply to the pennant.
Below is an illustration illustrating the shape of the pennant.
Get to know Wedge Formation
Get to know the Wedge Formation
A wedge is almost similar to a pennant. It's just that the slopes of the two triangular lines are unidirectional in the sense that they are both pointing up or down. The degree of inclination is different but in the same direction. The image below will clarify the definition of a wedge.
We can identify a wedge by looking at its slope, which is pointing up or down. As a general rule, it is almost similar to the flag – the slope of the wedge as a continuation pattern in the opposite direction to the current trend.
Thus, the falling wedge is a bullish pattern, while the rising wedge is a bearish pattern.
Notes:
Although the wedge is basically a continuation pattern, it can also function as a reversal pattern. However, this incident rarely occurs. A falling wedge can be a bullish reversal pattern if it occurs at the end of a downtrend. On the other hand, if the rising wedge appears during an uptrend, it could be a bearish reversal pattern.
Understand the Rectangle formation
Rectangle Formation Pattern
Rectangle formations go by many names, but these patterns are very easy to spot. This pattern represents a break that occurs where the price moves sideways between two parallel horizontal lines.
Rectangles are sometimes referred to as trading ranges or congestion areas. Whatever the name, this pattern represents a period of consolidation in a trend and is usually followed by a move that is in line with the previous trend.
A rectangle must have at least four reversal points. In the example image above, you can see an example of a rectangle that has six reversal points.
Confirmation of the bullish rectangle is a break of the resistance line, or upper line. Meanwhile, the confirmation of the bearish rectangle is a break of the support line or lower line.
Understanding the Differences in the Continuation Head & Shoulders Pattern
Continuation Head and Shoulders Pattern
Previously, we discussed the head and shoulders pattern as a reversal pattern. In the continuation head and shoulders pattern, the pattern formed is exactly the same as the head and shoulders pattern. The difference has the following points:
- The head and shoulders pattern appears during a downtrend. A break in the neckline is a confirmation of the continuation of the head and shoulders pattern.
- The inverse head and shoulders pattern appears during an uptrend. A break in the neckline is a confirmation of the continuation of the inverse head and shoulders pattern.
So, no need to be confused. All you need to remember is that the inverse head and shoulders pattern has bullish implications. Meanwhile, the head and shoulders pattern has bearish implications regardless of when the trend appears.

.jpg)
.jpg)






Post a Comment for " Price Patterns in Forex Trading"