The Candlestick Pattern's Popular History
For those of you who have been around for a long time or are still new to the world of trading, surely you will not be unfamiliar with candlestick patterns, right?
The popularity of this candlestick is what makes many traders use it to show prices.
Because visually, candlestick charts are easy to understand and the information presented in each candlestick is quite complete, including the opening price, lowest price, high price, and closing price.
Even on this chart, you will learn some candlestick patterns that often appear and are quite popular among traders when these patterns provide benefits for maximizing the opportunities that exist from forex trading transactions that will be carried out.
But before discussing further candlesticks, it's a good idea to know a little history of this popular chart!
Munehisa Homma-Inventor of Candlestick Patterns
He is Munehisa Homma, a rice trader who created the candlestick as a type of chart in forex trading, which has become quite popular and widely used by traders to date.
Candlesticks were first used around the 17th century in Japan and were used to calculate rice price movements.
Through Homma's ideas, he managed to get around the market with his analytical skills. The idea of creating an indicator that can be used to predict the direction of the trend is a very bright idea.
Over time, candlesticks are very useful for determining the movement of rice prices at that time.
For today's traders, Homma's 250-year-old creation is very useful for analyzing market price movements, not only for commodities, as this chart applies to the stock, futures, and forex markets.
With current developments, candlestick charts are becoming increasingly popular in the western world, where one of the people who is known to have popularized the analytical method using candlestick patterns is Steve Nison.
Through a book he wrote with the title "Japanese Candlestick Charting Technique," "the possibility of the emergence of the candlestick method began after the 1850s."
What Types of Candlestick Patterns Are Included?
 |
| Types of Candlestick Patterns. Photo by pixels.com/ANTONI SHKRABA |
By recognizing certain patterns contained in candlesticks, you can predict the direction of the next price movement.
Keep in mind that candlestick patterns are usually only followed by short-term corrections. These patterns are very useful if a trader wants to take advantage of correction opportunities.
Nevertheless, it is possible that the candlestick pattern can be followed by a reversal for a longer period of time.
Although it is quite tiring to learn these charts, they will be very useful when you make transactions in trading.
Overall, there are 3 types of candlestick patterns, namely:
Single Candlestick Pattern
Double Candlestick Pattern
Triple Candlestick Pattern
Quick Tips:
It is important to know where to buy and sell and take profit.
What is a Single Candlestick Pattern?
Learn more about the Single Candlestick Pattern
In this single candlestick pattern, there are no pairs and usually consists of one segment. They are the easiest to see.
There are several other types of patterns on single candlesticks that are quite often used by traders in trading. Anything?
Let's take a deeper look at this type of single candlestick pattern!
Before starting, it's better if you have a forex demo account first, so you can easily understand the existing patterns by comparing them directly.
Discussion about Marubozu
What is Marubozu?
Marubozu means "bald head."
In this type of candlestick pattern, you will find a body candle that has no shadow, either up or down. Even the visible shadow is thin enough that it just looks like a hairless head.
There are two types of marubozu that you need to know, namely the bullish marubozu and the bearish marubozu.
A bullish marubozu is a long bullish candlestick that has no shadow.
A bearish marubozu is a long bearish candlestick that has no shadow.
The appearance of this marubozu indicates that the bearish or bullish pressure is very large at that time period.
In general, bullish candlesticks are represented by white (empty), while bearish candlesticks are represented by black.
Therefore, a bullish marubozu is also often referred to as a white marubozu, while a bearish marubozu is referred to as a black marubozu.
The appearance of a bullish marubozu is a sign that, at that time, the bullish pressure was very strong. The appearance of a bearish marubozu indicates that bearish pressure was very strong at the time.
At the same time, there are indications that the trader is in control of the price from the beginning to the end of the trading session. Therefore, make sure you are always careful if this marubozu pattern appears during trading.
Long Candles You Should Be Aware Of
Type of Long Candle
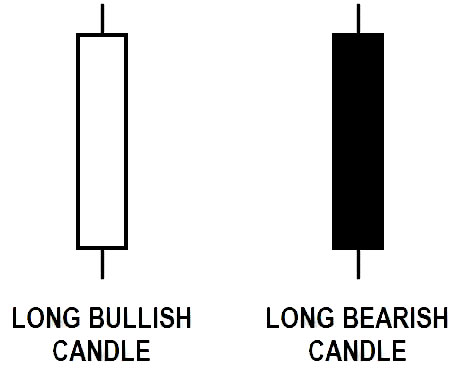
As the name implies, long candles are included in relatively long candlestick patterns.
The main benchmark in this long candle pattern is its long body size.
Not much different from marubozu, there are also two types of long candles, namely long bullish candles and long bearish candles.
The difference lies only in the shadow, where the long candle still has a shadow that is clearly visible, unlike the marubozu, which has no shadow at all.
 |
| Long Candle-Candlestick Pattern |
Spinning Tops In Candlestick Patterns
Spinning tops are candlesticks that have a long upper and lower shadow.
The hallmark of a spinning top is that it has two elongated shadows at the top and bottom with a small body size.
The body color of the spinning tops is not very important because the appearance of the spinning top pattern reflects the market's doubts about whether the price will move towards bullish or bearish.
This uncertainty is the main focus of spinning tops.
The small body on the spinning top illustrates that the bullish and bearish forces are of equal magnitude.
However, you need to pay attention to when this spinning top appears!
If the spinning tops appear at the end of an uptrend, there is a possibility that the market will reverse into a downtrend.
Likewise, if spinning tops appear at the end of a downtrend, there is a possibility that a reversal will occur in an uptrend.
However, spinning tops need confirmation from the next candlestick so that the direction of the next price movement can be estimated.
Basically, this chart is a pretty neutral pattern. Therefore, even if spinning tops appear at the end of an uptrend, a reversal will not necessarily occur.
However, the chance of a reversal will be even greater if the spinning tops that appear at the end of the uptrend are followed by a fairly long bearish candlestick.
Similarly, spinning tops appear at the end of a downtrend, requiring a bullish candlestick as confirmation.
A Complete Discussion About Doji
Doji Definition and Types
Not much different from spinning tops, the doji is a fairly neutral candlestick pattern. However, this pattern has more complex characteristics. It takes confirmation of the next candlestick so that you can predict the next market direction.
The doji candlestick has a very thin body that even looks like a line because the open and close prices are the same. This is because there is no one between the seller and the buyer who is able to take control.
Just like spinning tops, dojis also depict a balanced fight between bullish and bearish where you can see there are four types of doji in them, namely:
long-legged doji,
dragonfly doji,
dan doji gravestone
four-price doji.
 |
| Doji Type-Candlestick Pattern |
Let's take a closer look at how these four types of doji work!
1. Long-legged doji
Long-legged doji are recognized because the shadows of this type of candlestick are quite long.
As shown in the picture above, if the long-legged doji formation is formed in a downtrend, it is likely that the price movement will reverse towards the uptrend.
The length of the tail indicates that the previous seller's sentiment was stronger but turned to follow the buyer.
At that time, the price, which had reached its lowest level, quickly reversed direction. This also applies if it occurs in an uptrend movement.
2. Dragonfly Doji
The shape is like the letter (T), which makes the dragonfly doji have identical open, close, and high prices, even almost the same.
There are times when the body is in a slightly downward position, which makes the dragonfly doji have a cross-like shape.
The term "dragonfly" was chosen because this doji has a shape similar to a dragonfly.
3. Gravestone Doji
Not much different from the dragonfly doji, the gravestone doji has the same or almost the same open, close, and low prices.
This doji is given the name "gravestone" because of its shape that resembles a tombstone. There are times when the body position is slightly upward, so that the shape resembles an inverted cross.
When this gravestone doji type candlestick pattern is found, it will be very helpful in conducting technical analysis.
After the market experiences a long uptrend and is followed by the formation of this pattern, it means that the trade to continue buying must have ended. This could be the reason the price is too expensive.
In addition, the gravestone doji pattern can also give a signal to sellers to start selling activities.
4. Four-price Doji
The appearance of these four price doji usually indicates that the bullish or bearish pressure is starting to decrease.
So, if this doji appears during an uptrend, it will be a sign that the bullish pressure is decreasing. On the other hand, if the doji appears during a downtrend, it means that the bearish pressure is starting to decrease.
But again, confirmation is needed from the next candlestick to take action. Always remember that the doji is a neutral pattern.
The shape resembles a horizontal line without a tail at all on the top and bottom of the body, while the body is very thin.
The Four Price Doji will only appear if the open, high, low, and close (OHLC) prices are exactly the same in one candlestick bar formation period.
Get to know the Hammer and the Hanging Man
I'm aware of the hammer and the hanging man.
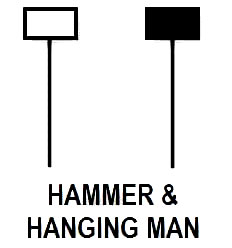
The Hammer and the Hanging Man are actually twins. These two forms are physically almost the same, but have different meanings when viewed from the process of the last price activity in a session.
Both have the characteristics of a short body shape (either black or white) with a long lower shadow and a short upper shadow.
Both also have the same shape, that is, they both have a small body and a long lower shadow.
 |
| Hammer & Hanging Man-Candlestick Pattern |
A good hammer/hanging man has a lower shadow that is at least 1.5 (one and a half) times the length of their body.
Several other references say that the lower shadow is at least two to three times longer than the body of this pattern.
The difference between a hammer and a hanging man only lies in their location, where the hammer is always located in the valley, while the hanging man is always at the top.
 |
| Hammer Position & Hanging Man-Candlestick Pattern |
 |
| Bullish Signal HAMMER,Mt4 Chart |

The appearance of the hammer is a bullish signal, while the appearance of the hanging man is a bearish signal.
The hammer will be a strong bullish signal if it is supported after the appearance of the bullish candle. Likewise with Hanging Man, this pattern will be a stronger bearish signal if it is supported by the appearance of a bearish candle after it.
In practice, candlestick patterns are often combined with other indicators and analytical tools, such as stochastic or Fibonacci retracements, to provide traders with balanced market movements.
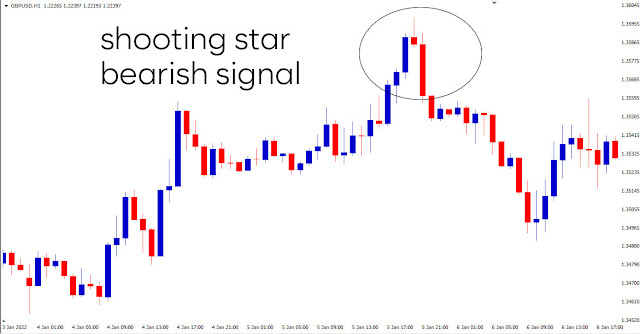
You know the difference between an Inverted Hammer and a Shooting Star?
The Distinction Between Inverted Hammer and Shooting Star
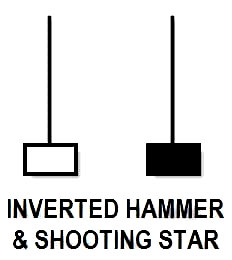
Inverted Hammer and Shooting Star are twin brothers, just like Hammer and Hanging Man. The only difference lies in the inverted body position.
Both have a small body and an upper shadow, which is usually about 1.5 to three times the length of the body.
The lower shadow is barely visible, and even the perfect shape has no lower shadow at all.
 |
Inverted Hammer and Shooting Star-Candlestick Pattern
 |
| Inverted Hammer and Shooting Star Positions - Candlestick Pattern |
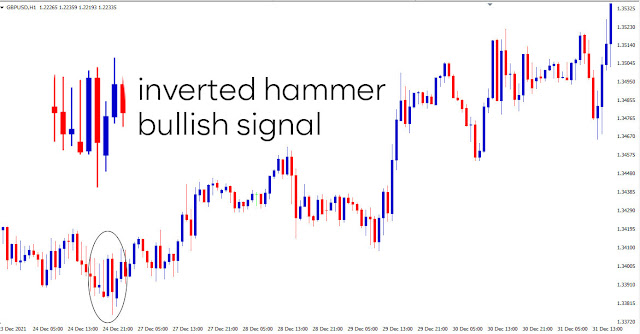
An inverted hammer is a bullish signal that requires confirmation by the bullish candlestick that appears after it.
While the shooting star is a bearish signal, it also requires confirmation by the bearish candlestick that appears after it.
Are you quite familiar with the single candlestick pattern and the types of patterns contained within it?
If so, it's time for you to move on to a more complex discussion, namely the double candlestick pattern.
Dual Candlestick Pattern
Pay attention not only to the appearance of the body candle, but also to the candle next to it.Let's take a deeper look at this type of dual candlestick pattern!
Remember not to forget!Make sure you always try to look for similar patterns, then compare them with actual candles on a demo account so you can easily understand candlestick patterns to achieve maximum profit potential from forex trading.
Understanding the Engulfing Pattern
Types of Engulfing Patterns
Many traders often take advantage of this pattern as a signal for entry. Besides being easy to observe, the probability of trading with the engulfing pattern is quite high, especially in trending market conditions.
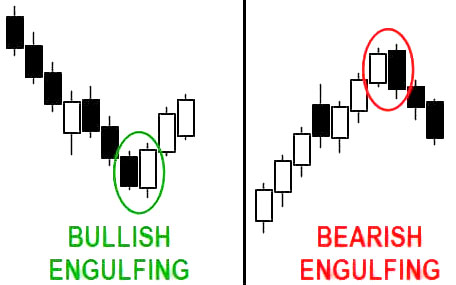
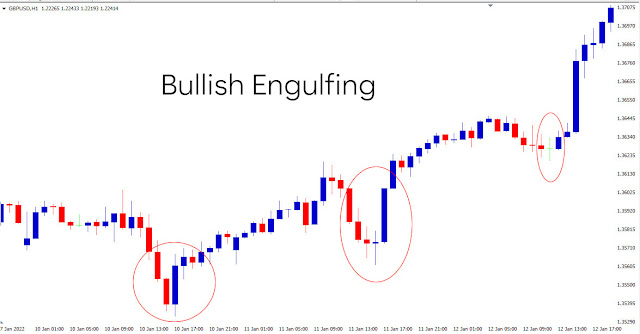
There are two types of engulfing patterns that you must first know, namely bullish engulfing and bearish engulfing.
In the picture above, you will see an engulfing pattern that can be recognized when there is a candlestick that is longer than the previous candlestick.
The longer candlestick should look as if it "covers" the previous candlestick. The bullish candlestick that appears in the picture above looks longer than the previous bearish candlestick.
The low price of the bullish candlestick need not be lower than the low price of the previous bearish candlestick. However, the high price must be higher than the previous high candlestick price.
The close price of the bullish candlestick should also be higher than the previous high candlestick price, but this is not a must.
Meanwhile, bearish engulfing is the opposite of bullish engulfing.
This pattern indicates a bearish potential where the appearance of this pattern is indicated by a bearish candlestick that is longer than the previous bullish candlestick.
For a clearer comparison, you can use the greater (>) and less () signs, like in the example below!
Bullish Engulfing
Previous high bearish candlestick price > High bullish candlestick price
The close price of the bullish candlestick > the previous high price of the bearish candlestick (not a requirement)
Bearish Engulfing
The low price of the bearish candlestick is higher than the low price of the previous bullish candlestick.
The close price of the bearish candlestick is less than the low price of the previous bullish candlestick (not a requirement).
Harami Candlestick Pattern
What Do Harami Candlestick Patterns Look Like?
Harami is a Japanese word that means "pregnancy".
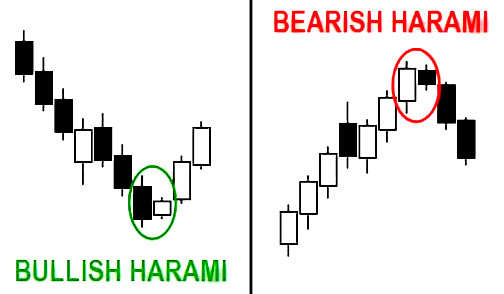
The Harami candlestick pattern is formed from two candlestick bars (bars), where the second body bar is always smaller and is within the range of the first body bar.
This harami pattern can be said to be the opposite of the engulfing pattern. The difference is in Harami, the candlestick that appears is smaller than the previous candlestick.
The existence of a bullish harami is indicated by the appearance of a candlestick that is smaller than the previous candlestick, which is a bearish candlestick.
While bearish harami is marked by the appearance of a bearish candlestick that is smaller than the previous candlestick.
Basically:
Bullish harami is a bullish pattern, and
Bearish Harami is a bearish pattern.
Terms of Use Dark Cloud Cover & Piercing Line
Dark Cloud Cover & Piercing Line Terms
Dark cloud cover and piercing line are also quite popular double candlestick patterns. Dark cloud cover is a bearish pattern, on the contrary piercing line is a bullish pattern.
These two patterns can help you determine the entry position without having to feel difficult.
In the picture above, you can see the piercing line pattern occurred in the valley and is a bullish pattern as mentioned earlier. This pattern consists of a bullish candlestick and a bearish candlestick.
Piercing Line Pattern Requirements
A pattern can be called a piercing line if it meets the following requirements:
The low price of the bullish candlestick is lower than the low price of the previous bearish candlestick.
The close price of the bullish candlestick is higher than the close price of the previous bearish candlestick.
The length of the bullish candlestick body is at least half the length of the previous bearish candlestick body.
Dark Cloud Cover Pattern Terms
Meanwhile, dark cloud cover can be called a bearish pattern if it meets the following requirements:
The high price of the bearish candlestick is higher than the price of the previous bullish high candlestick.
The closing price of the bearish candlestick is lower than the closing price of the previous bullish candlestick.
The length of the bearish candlestick body is at least half the length of the previous bullish candlestick body.
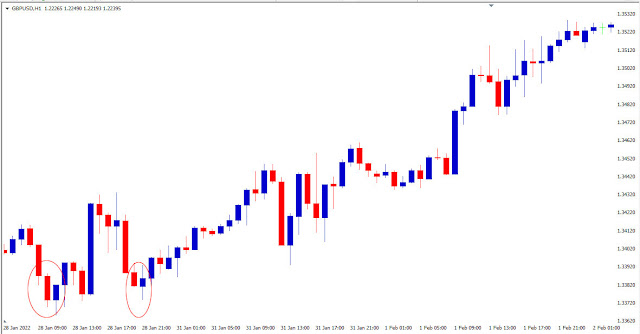
Get to know Tweezer more deeply.
Recognizing Tweezer Patterns
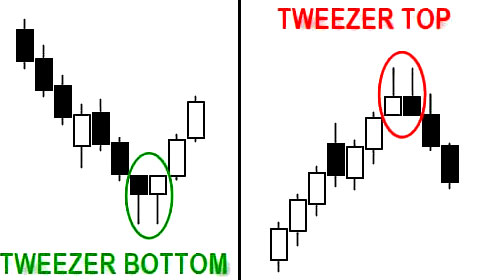
The word "tweezer" can mean "clamp" when translated into Indonesian. It is said that this name was given because the shape of this pattern is similar to a clamp.
A tweezer is formed with a candlestick body that is visible from the difference between the opening and closing prices.
If there is a "shadow" on the tweezer at both ends of the candle, it will be marked with the high and low prices of the period.
Tweezers are usually located above and below, and have patterns that indicate a trend reversal, although the wider context usually requires additional candles to confirm the signal.
There are two kinds of tweezers patterns, namely:
- Tweezer Top
- Tweezer Bottom
This pattern is one that appears quite rarely. Even so, recognizing these two patterns is not so difficult.
The tweezers' bottom is a side-by-side hammer shape. While the tweezer top is an inverted hammer (shooting star, because it is on top) side by side.
Triple Candlestick Pattern
Understand the Triple Candlestick Pattern
Already understand the dual candlestick pattern?
Now is the time for you to start understanding the last and quite popular candlestick pattern, namely the triple candlestick pattern.
What Is the Difference Between a Morning Star and an Evening Star?
Do You Know What the Morning and Evening Stars Look Like?
For traders with candlestick formations, the Morning Star pattern and the Evening Star pattern can be analogized as a green light to hunt for profits. Is that right?
There's no need to rush. These patterns are indeed quite popular because their appearance is usually followed by a longer correction than other patterns.
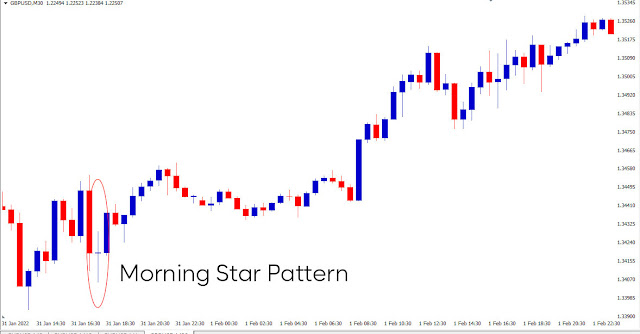
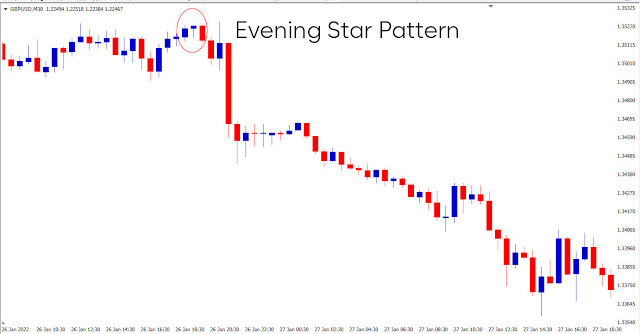
The morning star is a bullish indication, while the evening star is a bearish indication.
Characteristics of the Morning Star Pattern
The first candlestick is a bearish candlestick, which is part of a downtrend.
The second candlestick is a candlestick that has a smaller body. It can be a bullish or bearish candlestick. This indicates that there is "hesitancy" in the market.
The third candlestick is a longer bullish candlestick than the second candlestick. The length does not need to be the same as the first candlestick, but the close price position must exceed half of the body of the first candlestick. This is confirmation of the formation of the morning star pattern.
Evening Star Pattern Characteristics
How about the Evening Star? What are the characteristics of this pattern?
The first candlestick is a bullish candlestick, which is part of an uptrend.
The second candlestick is a candlestick that has a smaller body. Whether it is bullish or bearish is not important.
The third candlestick is a bearish candlestick that is longer than the second candlestick. The length does not need to be the same as the first candlestick, but the close price position must exceed half of the body of the first candlestick. This is confirmation of the formation of the evening star pattern.
There are times when these two candlesticks become a doji, so the pattern name can be modified to Morning Doji Star or Evening Doji Star.
The Advantages of Three White Soldiers and Three Black Crows
The Difference Between Three White Soldiers and Three Black Crows
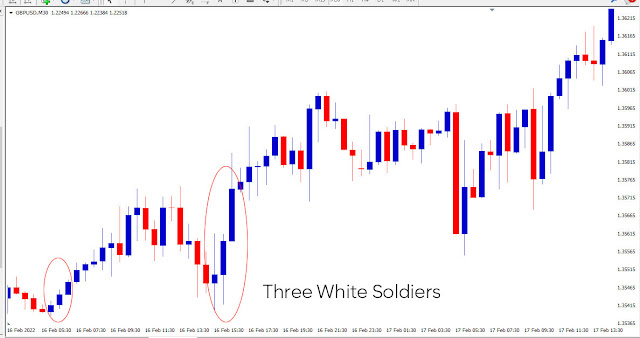
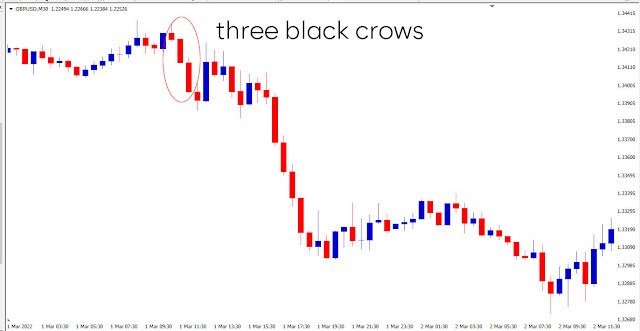
Three white soldiers and three black crowds are included in the category of reversal candlestick patterns. That is, after the formation is complete, the price will have the potential to change direction from the previous trend.
If previously the price was bullish, it will reverse down. Meanwhile, if previously the price was bearish, it will go up.
What's the difference between the two?
Three White Soldiers is a pattern that is considered a strong bullish signal, especially if it appears when the downtrend enters the consolidation phase.
The consolidation phase in a trend itself is when prices tend to move sideways.
The second candlestick also becomes a bullish candlestick whose body is longer than the first candlestick.
In addition, the distance between the closing price and the high of the second candlestick should not be too far. The upper shadow must be very short or none at all.
Thus, this pattern will be completed with the appearance of a third candlestick that is approximately the same length as the second or longer candlestick.
The shadow that is owned must be very short or not at all. However, it would be better if the third candlestick was a white marubozu.
Unlike the three white soldiers, the three black crowds are a bearish pattern marked by the appearance of three consecutive bearish candlesticks during an uptrend.
The first candlestick in this pattern is a bearish candlestick.
The second candlestick must also be a bearish candlestick whose body is longer than the first candlestick.
The lower shadow of this pattern must be very short or non-existent.
Confirmation of this pattern is the appearance of a third candlestick that is approximately the same length as the second or longer candlestick.
Shadows owned by this pattern must also be very short or non-existent. So, if the third candlestick is a black marubozu, then this pattern will be even better.
The Advantages of Candlestick Patterns in Trading
What benefits will you get from knowing this type of candlestick pattern?
1. Make analysis easier for you.
Candlestick patterns help you identify price movements. In addition, candlesticks have clear rules that make it easier for you to analyze the market.
Traders will quickly find out who controls the market, whether bullish or bearish, by looking at the color of the candlestick body.
In addition, the length of the candlestick body also shows how dominant the bullish or bearish condition is if the body is short and the shadow is long, which indicates market doubt.
2. Complementary Indicators in Technical Analysis
Candlesticks can be used in conjunction with other technical analysis tools. In technical analysis, the use of candlestick patterns can be used as a confirmation tool that is used together with several indicators.
This is because candlesticks use the same opening, high, low, and closing prices as bar charts. This can strengthen the analysis of the candlestick.
Quick Tips:
It is important to know where to buy and sell and take profit.
Candlestick Tips & Tricks
As a note!
The types of candlestick patterns above are included in the category of patterns that are quite popular and are often used by traders.
Before starting trading, you need to understand the usefulness of the chart and how it can be used optimally.
Quick Tips: How to Quickly Master Candlesticks
Complete the course on this candlestick pattern.
Sharpen understanding by trying to find patterns on a demo account.
Try trading based on the patterns you find on the demo account.
Evaluate each transaction to hone your analytical skills.
Practice on a demo account consistently.








Post a Comment for " A Complete Discussion of Candlestick Patterns"