Moving Average Convergence Divergence History
The Moving Average Convergence Divergence (MACD) Indicator
In the late 1970s, a doctor in the United States named Prof. Gerald Appel developed a technical indicator called Moving Average Convergence Divergence (MACD) where this indicator became a powerful weapon in the traders' arsenal.
This indicator is used to confirm the strength and direction of the trend, as well as to determine the point of reversal (reversal). In addition, MACD can also provide information on whether the current trend is strong enough or not.
Because the MACD indicator is quite easy to interpret and confirm, this indicator can be used by anyone, be it a beginner or experienced.
That is why many traders consider MACD to be the most efficient and reliable technical indicator.
Understanding How MACD Works
MACD Functions and Mechanism
In addition to providing information about the current trend, in general, the Moving Average Convergence Divergence Divergence (MACD) can be used to:
- Measuring market momentum, whether conditions have been overbought or oversold,
- See if there is a bullish or bearish divergence.
This function is quite popular because the results can be accurate if the signal occurs simultaneously with overbought or oversold market momentum.
MACD is an indicator to detect overbought and oversold by looking at the relationship between long-term and short-term moving averages.
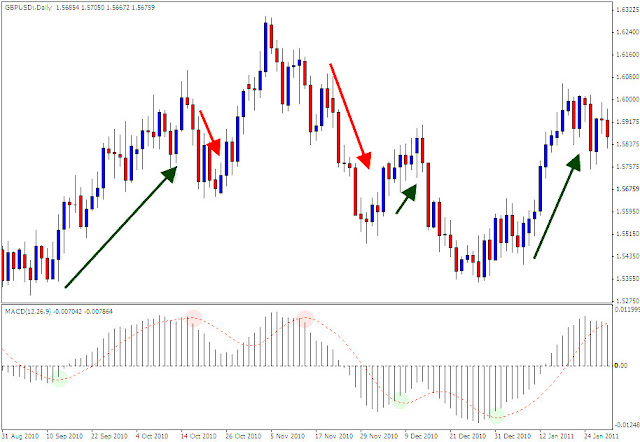
The standard MACD that is built into the Metatrader platform has the following components:
- MACD Signal Line-usually displayed as a dotted red line-
- MACD Histogram-in the form of vertical lines
- The MACD Zero Line
How does this component work?
A histogram is an indicator that predicts whether the trend is strong enough or not. If the histogram is getting longer, it means that the momentum is getting bigger (the downtrend is getting stronger). However, if the histogram is getting shorter, then there is an indication that the momentum is decreasing. This will usually be followed by a correction.
In addition to the histogram, MACD can also be used to find entry signals.
The method is quite easy.
You can pay attention to the histogram and MACD signal line.
When the MACD signal line "breaks away" from the histogram, that is the signal.
A buy signal occurs when the MACD signal line breaks from the histogram below the zero line, while a sell signal occurs when the MACD signal line breaks from the histogram above the zero line.
How Does the Moving Average Convergence Divergence (MACD) Indicator Work?
Despite having advantages, the MACD indicator still has disadvantages. The default setting of MACD often generates fake signals.
Therefore, you should be careful using this indicator when trading and use it on rather long time-frames such as 4-hour charts or daily charts.
Types of Divergence With MACD
Finding Divergence With MACD
Divergence is a condition where the price is moving up but the MACD line or histogram is getting lower. The divergence signal from the MACD indicator can be used as a reference to determine the ideal open position.
There are two types of divergence that can be used as a reference for entry, namely:
- Bullish Divergence for Entry into a Buy Position and
- bearish divergence for entry into sell positions.
Then, how to use the MACD indicator when there is a bullish or bearish divergence?
Bullish Divergence
Bullish divergence occurs when the chart valley is getting lower but the histogram is getting higher. At that time, the histogram was below the zero level. Confirmation of the bullish divergence is when the histogram rises above the zero level, as in the example below.
Bearish Divergence
Bearish divergence occurs when the top of the graph is getting higher but the top of the histogram is getting lower. At that time, the histogram was above the zero level. Confirmation of a bearish divergence is when the histogram drops below the zero level, as in the example below.
It is important for you to have knowledge of divergence so that you don't make the wrong entry. A lack of understanding of divergence can get you stuck in a difficult situation, especially when you want to buy or sell.
If you can use this indicator correctly, then you can find and generate the maximum profit potential.
Conclusion
MACD is a very reliable technical indicator. This indicator can produce various signals and can identify the strong fundamentals of the trading system.
Even though it has a weakness where MACD often raises fake signals, you don't need to worry. To filter out false signals, use MACD in combination with other technical analysis indicators.

-Indicator.jpg)


Post a Comment for "Moving Average Convergence Divergence, Understanding How MACD Works"