An Introduction to Moving Averages?
If you are trying to become a forex trader, there are many aspects you need to know about, including moving averages.
The Moving Average is one of the forex analysis tools and the most popular technical method used by traders around the world.
In general, the moving average is a technique that you can use in trading to smooth out price changes in the forex market over a certain period of time. With this technique, the process of buying and selling currency transactions that you do will be easier and smoother.
The important thing you need to know is that technical indicators are not tools that can "forecast the future" and are always correct. On the other hand, technical indicators serve as tools to identify potential price movements.
Then, what exactly is a moving average?
It's time for you to get acquainted with the world's favorite trading tool!
What is a Moving Average?
A moving average is a line obtained from the calculation of prices before today, which calculates the average price movement of a market in a certain time span.
For example, in the range of
5 days (1 week),
20 days (1 month),
60 days (3 months), or
6 months = 120 days
So, it can be said that the Moving Average 60 means price movement for the past 3 months.
Moving Averages are a good way to measure momentum as well as to confirm trends and define areas of support and resistance.
The terms are dynamic support and resistance (dynamic support and resistance). It is so named because it moves according to price movements.
- During an uptrend, MA serves as support.
- On the other hand, during a downtrend, MA functions as resistance.
This indicator "smooths" price movements over a certain time frame, so you can easily identify the trend or direction of price movement in general.
The standard price used is usually the closing price (close), but there are several methods that use open, high, or low prices.
For more clarity, let's look at the sample image below!
 |
| Moving average trategy trading for profits |
Take a look!
The red line seen on the chart is an example of a moving average indicator that has a period of 50 (MA 50).
That is, the indicator takes price data from the last 50 candlesticks and describes it as the line you see.
As you can see in the picture above, the MA (Moving Average) can show the ongoing trend.
If the price is generally below the MA, then the current trend is a downtrend. Conversely, if the price generally moves above the MA, the current trend is an uptrend.
The trend in the picture above for the AUD/USD pair on the hourly chart is down (downtrend).
The steeper the slope of the MA, the more it is a sign that the trend is getting stronger. Thus, you can more easily predict the potential direction of the next movement.
Pretty easy, isn't it?
If you are already starting to understand the analysis of this moving average, now is the time to take a look at the types of this popular tool!
Then, what are the types of moving averages that are quite popular and are a favorite of traders?
How to Calculate the Simple Moving Average (SMA)
Simple Moving Average (SMA) Calculation
The Simple Moving Average (SMA) is one of the simplest moving average indicators that is widely used by traders in their trading.
Although simple, SMA has good capabilities if accompanied by proper use because it can lead you to recognize price movements well.
Then, what is the right way to calculate this indicator? Take a look at the illustration below!
If you use the 50 SMA on the hourly chart, then
The 50 SMA you see is the result of adding up the last 50 closing prices and then dividing that sum by 50.
Thus, you have the average closing price over the last 50 hours.
This formula is the same as how to calculate the moving average in general.
Pretty easy, isn't it?
No need to worry about calculating SMA properly because the trading platform you use usually already provides this tool.
At least you get an idea and have a solid foundation if you want to modify this Simple Moving Average according to the strategy you have.
The other important thing that you need to know again is that the moving average smooths price movements.
The larger the period used, the better the resulting moving average. The better the resulting moving average, the longer the reaction time to price movements.
For a complete explanation, let's look at the comparison between SMA 20 and SMA 50 in the image below!
 |
| Comparison between SMA 20 and SMA 50 |
In the picture above, you can see the blue 20 SMA has more lines than the red 50 SMA.
What does this line mean?
The 20 SMA has a shorter period and reacts more quickly to price movements compared to the 50 SMA, which tends to take longer to react to price movements.
From the picture, you can see that the market is trending. The two SMAs you see on this chart are depicting a general trend movement, which is known as a downtrend.
What about the Exponential Moving Average? Does it have the same calculation as the Simple Moving Average? Let's take a closer look at the explanation!
Get to know more about the Exponential Moving Average.
What is the exponential moving average?
An Exponential Moving Average (EMA) is a type of moving average (MA) that places greater weight and significance on the most recent data points.
Although the calculation of the EMA is not as simple as the SMA, the EMA gives more weight to the calculation of the average price in a certain time frame.
The effect that occurs is that the EMA tends to be more sensitive to price movements, so the EMA moves a little more aggressively than the SMA.
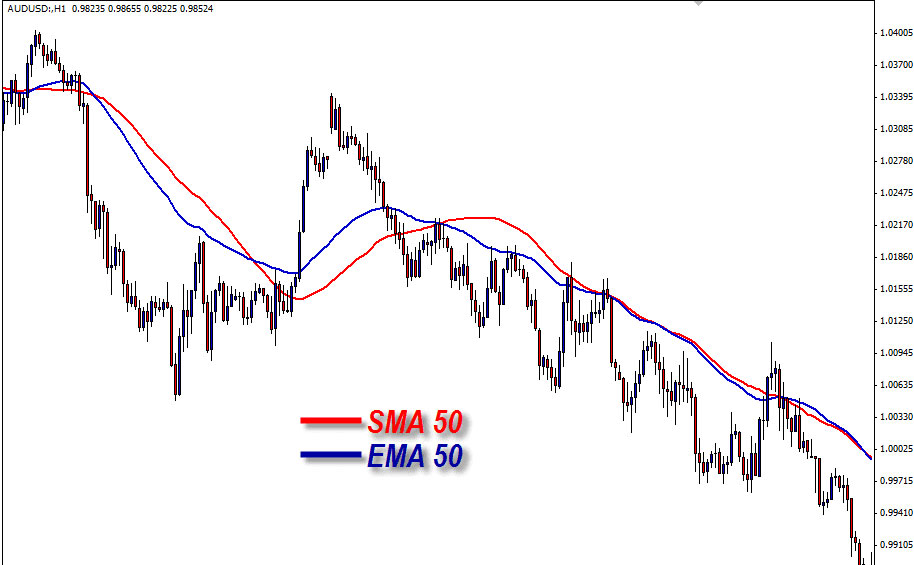
Still No Idea About EMA? Let's look at the image below!
The Exponential Moving Average
What can you conclude from the picture above?
True, the picture above shows the SMA and EMA are on the same chart. The period used is also 50, but the difference lies in the calculation method.
You can see that the 50 EMA is always closer to the 50 SMA.
In conclusion, you can see that the EMA is more descriptive of what happens to the price action compared to the SMA.
Then, what is the difference between EMA and SMA?
The main difference between the Simple Moving Average and the Exponential Moving Average is the sensitivity of each in showing changes in the data used in its calculations.
The EMA gives a higher weight to new prices than the SMA, which gives the same weight to all values.
The two averages are similar in that the SMA and EMA are essentially interpreted in the same way, and both are commonly used by technical traders to smooth out price fluctuations.
The EMA places a higher weight on recent data than on older data, is more reactive to recent price changes, makes the results of the EMA more timely, and explains why the EMA is the preferred type of MA by the average trader.
How about SMA ?
If you want a moving average that is smoother and slower in responding to price action, then SMA is an option that you can use.
SMA is the opposite of EMA. The SMA indicator will work better when looking at a longer time frame than the EMA because it will be able to give you an idea of the overall range of a trend.
Although slow to respond to price action, SMA can be a function that saves you from false signals. Even so, it may take you longer and you may lose the moment to take a position when the price reverses direction.
Simple Moving Average or Exponential Moving Average?
Comparison of Simple Moving Average with Exponential Moving Average
So, which is the best between the Simple Moving Average and the Exponential Moving Average? Of course, depending on your characteristics in trading,
If you are an aggressive trader and want to get a quick reaction to price movements, then the EMA is the right choice. By using EMA tools, you will be able to catch opportunities faster than SMA.
Thus, the profit obtained will certainly be greater. But keep in mind, you can be trapped by fake signals (false signals) given by the EMA at one time.
When compared to the SMA, you will get a slower reaction to price movements than the EMA. Thus, the opportunities given will be slower to appear, and you may at one time lose the best time to take a position.
However, you certainly will not be easily trapped by false signals, and the profit generated will be smaller than the EMA.
Each indicator, of course, has its own advantages and disadvantages. Therefore, don't make the mistake of choosing an indicator that suits your characteristics as a trader.
You need to pay close attention if the price moves through the MA (a breakout occurs), because it is an early indication (not a certainty) that the trend will change direction.
Remember! During an uptrend, the best strategy you should do is buy. And during a downtrend, the best strategy you should do is sell.
In an uptrend position, you can use the moving average as a reference area to buy. Conversely, if at that time you are in a downtrend position, you can use the moving average as a reference area to sell.
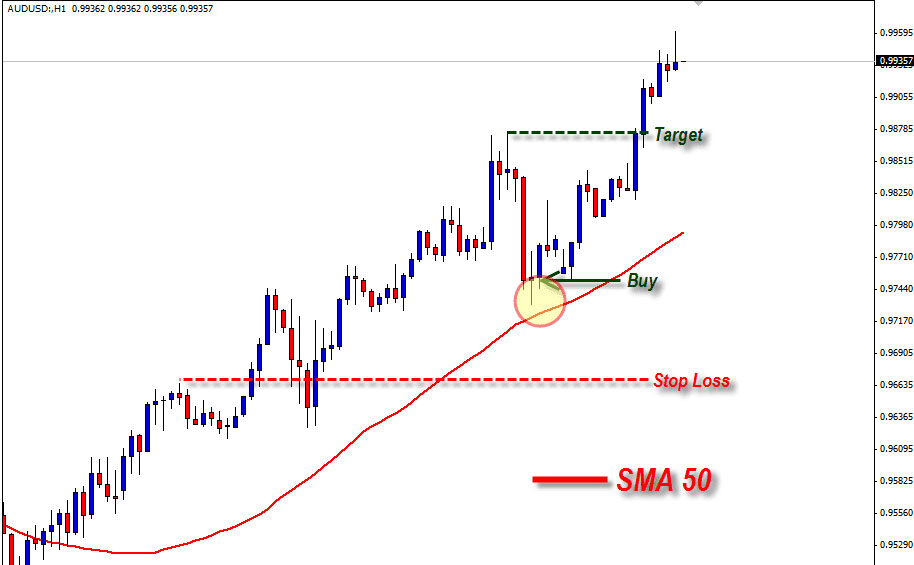
You can apply this strategy to bounce trading. Take a look at the image below!
In the picture above, you will see the 50 SMA indicator, which is plotted on the hourly chart. At that time, you get confirmation that a bounce occurred because the price corrected and then approached the 50 SMA.
The stop loss level shown in the picture is the exit point based on the closest support. The target level taken is the closest resistance.
Keep in mind that if you buy using the MA, make sure that the MA line is going up (up). If so, what will happen next?
The bounce is valid and your target has been reached!
When the price pulls back to the moving average area, all you need to do is wait for the confirmation bounce to sell.
Have you got the picture?
If not, you can see the image below.
How do you do the analysis on the chart above?
The first thing you should pay attention to is whether the SMA line is going down. When the price pulls back to the SMA area, make sure that the slope of the SMA remains in a downward (downward) position.
From the picture, you will see that the price just touched the SMA line. Even though there was a false break, the price immediately moved down and moved below the SMA.
This situation illustrates that bearish pressure is greater than bullish. Therefore, you can take short positions with the target at the closest support and stop loss at the nearest resistance.
If you have taken a position, what will happen next?
Pretty simple, isn't it?
However, it should be noted that the scenario that occurs will not always be like the picture above. It could be that the bounce that occurs fails and the price will reverse and then penetrate the Moving Average sadistically. So, be careful!
That is why you need to place a stop loss, of course, with a note: keep a good strategy and risk management so that even a simple strategy can bring you consistent profits.
In addition, there is a development from the use of Moving Averages that you need to know as an entry point.
One development that is quite popular is combining two moving averages on one chart, where the combination is between SMA 20 and SMA 50.
This strategy is referred to as the Double Moving Average.
The function of this development is to exploit the gap, which is the area between the two MAs.
From the picture above, you can see that a sell is made when the price enters the intended area (gap). If you trade using this strategy, make sure that at least two of the following conditions are met:
Both moving averages must have the same slope direction.
If you want to buy, then the slope of the two moving averages must be up (up).
If you are going to sell, then the slope of the two moving averages must be down (down).
The price is already inside the gap which is the area between the two moving averages.
Then, how does the double moving average strategy work when you buy?
What you need to pay attention to is that the gap in the moving average can be used for entry.
So, when the price enters and the candlestick closes in that area, then you can make a transaction.
No need to worry, because there will be additional tools that can help you determine the right time to take action.
Crossover of the Double Moving Average
Understanding Double Moving Average Crossover:
The use of Double Moving Average Crossover is not much different from the use of other moving averages.
It's just that you need to use more than one moving average line, and it depends on how many moving average numbers are used.
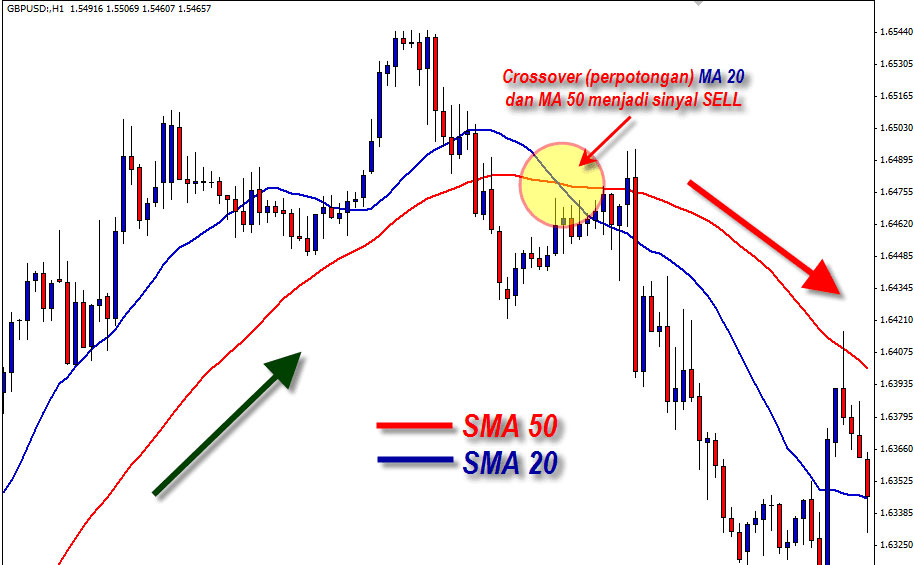
You can use the intersection between these two moving averages as a signal or an early indication that the trend will change direction and can be used as a signal for entry as shown below.
In the picture, you will see the SMA plotted on the hourly chart for the GBP/USD currency pair. The price movement that occurred from May 27, 2011 to approximately May 31, 2011 was up.
However, around June 1, 2011, a crossover occurred between SMA 20 and SMA 50. After a slight pullback, GBP/USD was seen sliding down from June 1, 2011 to June 2, 2011.
If you go short when the two SMAs intersect, then on June 2 you will have gained at least 100 pips!
How about buying?
Let's take another look at the image below!
The crossover from the bottom up is a buy signal. Of course, you can use it as an exit point if you have bought based on the previous double MA strategy.
So, apart from being an entry point, the double MA intersection can also be used as an exit point.
Pretty easy, isn't it?
What are the benefits of moving averages in forex trading?
1. Consistent price movement
One of the functions of the moving average, as an indicator that helps smooth price movements, is to detect the direction of the trend.
The basic theory that becomes the reference is:
If the moving average line tends to rise, it means that the trend tends to be bullish.
If the moving average line tends to fall, it means that the trend tends to be bearish.
However, it should be noted that if the moving average forms a hill and valley pattern simultaneously, the trend tends to be sideways.
2. Recognizing a trend reversal
To determine the trend reversal point, you can simply see when the price breaks the Moving Average. If what is broken is the short-term MA line, then the reversal is also for the short term.
3. Determine the level of support and resistance.
Moving averages can be used as psychological levels for support and resistance.
When the price is close to the moving average, often the price will bounce back, so that it is as if the moving average acts as a "barrier wall" for price movement.
Therefore, if the price breaks through the moving average, then this can be said to be a reversal signal.
However, it should be noted that the scenario is not always the same. That is why you need to place a stop loss, of course, with a note: keep a good strategy and risk management so that even a simple strategy can bring you consistent profits.


Post a Comment for " Moving Averages Strategy in Forex Trading"