Get to know the Bollinger Bands
Who is not familiar with Bollinger Bands?
This indicator is in the form of lines drawn in and around the price movement structure of a commodity or stock that creates Bollinger Bands will show the relative limits of price increases or decreases.
Initially, this indicator was developed by a well-known technical trader named John Bollinger. The origin of the Bollinger Band indicator dates back to the first personal experience on a microcomputer in 1977.
Since then, Bollinger has been involved in the computer business based on technical analysis.
Computer technology supported Bollinger to develop the Power Group, which is kept as a track record of developments and trends in the industry sector.
This is where the development of the Bollinger Band begins.
How to Use Bollinger Bands
How Do Bollinger Bands Work?
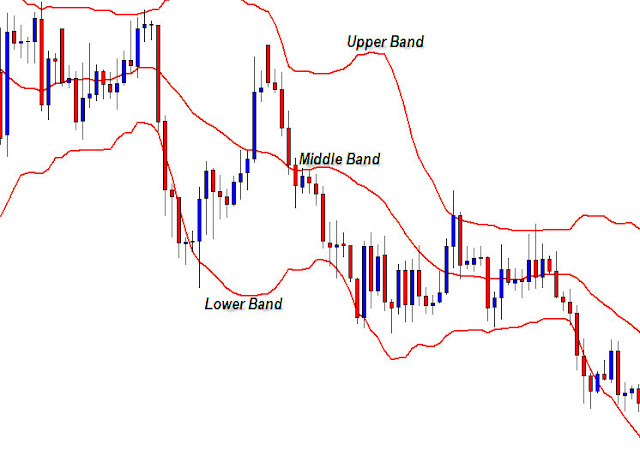
Bollinger Bands can actually help you measure market volatility and estimate the range (or range) of price movements. This indicator consists of three lines that move according to price movements, including:
- Upper Band
- middle band
- Lower Band
For more details, you can pay attention to how the Bollinger Bands work in the image below!
 |
| How Bollinger Bands Work |
The middle band is actually a moving average, which is the basis for calculating the upper and lower bands. Usually, the middle band used is a simple moving average.
In the picture above, it can be seen that the distance between the upper and lower bands and the middle band is affected by the volatility that occurs.
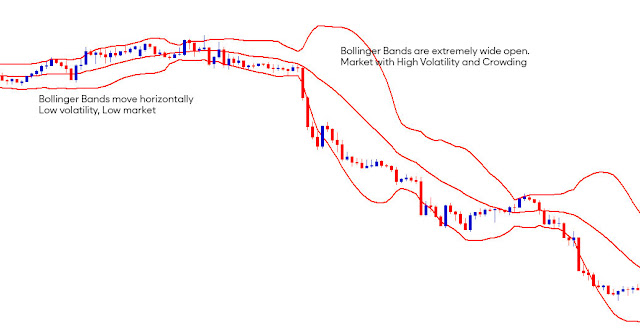
The greater the volatility, the wider the distance between the bands. Vice versa
That way, Bollinger Bands (BB) can help you identify current market conditions. When BB is wide, it means the market is busy.
However, when BB is narrowed and tends to move flat, it means the market is in a quiet state.
 |
| BB calculations that involve high-level math calculations |
No need to learn BB calculations that involve high-level math calculations. You can learn the practical use of BB and take advantage of indicators to read opportunities for price movements using a demo account.
Discover Bounce Trading
Learn the Bounce Trading Strategy.
Interestingly, you can apply the bounce trading strategy to Bollinger Bands by using the upper and lower bands as areas of support and resistance.
In this case, the upper band acts as dynamic resistance and the lower band as dynamic support. The middle band will also be involved in it as a target.
The price tends to bounce back to the middle band after reaching the upper or lower band. In a position like this, you can take advantage of these conditions to find entry points.
You can look for buy levels in the lower band area or look for sell levels in the upper band areas. Of course, the target is the middle band area.
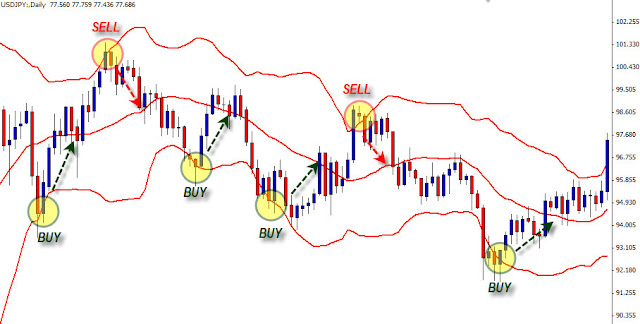 |
| Buy levels in the lower band area or look for sell levels in the upper band areas |
When the price reaches the upper band, it is difficult for you to determine the current price position—whether to stop there or break above the upper band. However, this area is a good place to sell.
In order not to be mistaken in confirming the position, you can wait for confirmation of the reflection in the form of a candlestick or bar chart that closes below the upper band.
If you have found confirmation of the price position, you can sell with a target in the middle band. Likewise, if you want to determine the right time to buy, that is when the price has reached the lower band.
Finding a stop loss position is quite easy.
You can look for the nearest support or resistance.
Please note that the bounce trading strategy with BB is quite effective when the market is in a sideways state.
In addition, this strategy is also effective for use in long time frames, for example on 4-hour charts or daily charts.
However, it is possible that this strategy can also be used when trending, although you have to be more careful.
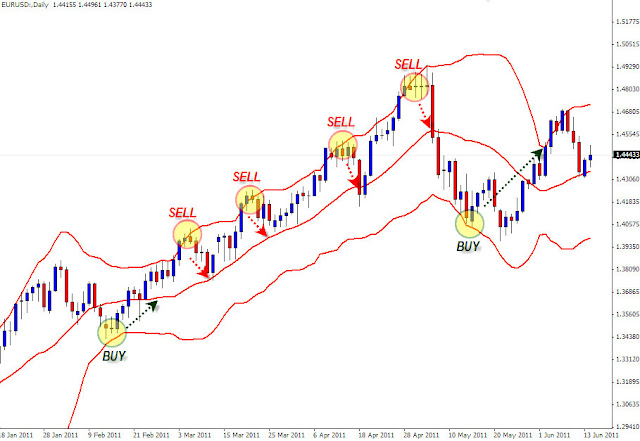 |
| Bounce Trading Strategy with Bollinger Bands |
Vital Records:
Discover How to Use a Breakout Trading Strategy
Use of the Breakout Trading Strategy and its Advantages
Some traders use BB as an indication when a breakout is imminent.
At that time, supply and demand have the same strength, so the price will move in a relatively narrow range and cause the Bollinger band to also narrow.
The breakout that occurs is usually followed by a BB that quickly widens and at that time the price breaks through the upper band or lower band.
This condition is a signal for you to act.
If the upper band breaks, then the strategy you can use is to buy. On the other hand, if the lower band is successfully broken, then the strategy you can use is to sell.
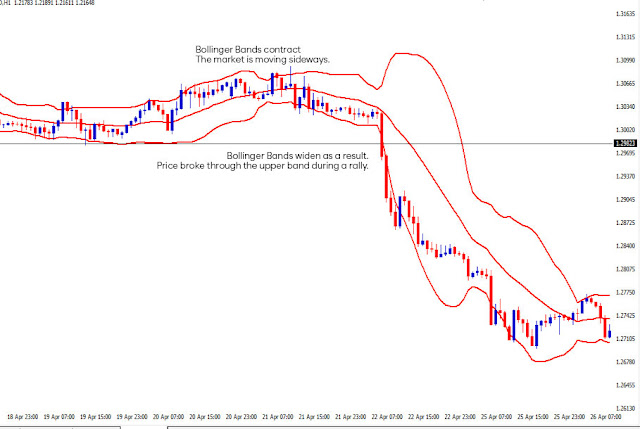 |
| Breakout Trading Strategy and its Advantages |
By implementing this breakout strategy, your chances of capturing opportunities that arise after the breakout will be greater. But there are times when what happens is a false breakout, and you can experience losses from this.
A breakout strategy using BB is usually applied to a smaller time-frame to anticipate a false breakout. For example, on a chart of 1 hour or less (15 minutes or 30 minutes),
Advantages of the Bollinger Bands Indicator
The advantages of the Bollinger Band Indicator are:
- Detect the end of a trend.
- Knowing the occurrence of sideways
- Detect overbought
- Knowing oversold
- can be used to see patterns double top, double bottom and Change of momentum
Basically, this indicator can be used to detect long-term trends. To support the use of this indicator in your trading, use additional indicators to strengthen the signal given.


Post a Comment for "A Complete Discussion About Bollinger Bands "