Get to know the Commodity Channel Index
The Commodity Channel Index is a technical analysis indicator developed and used to identify cyclical trends in an instrument.
Initially, this indicator was used to analyze the direction of commodity prices. But then it developed into one of the popular indicators and is widely used to analyze the movement of stock indices and forex (currencies).
This indicator was first introduced by Donald Lambert in his 1980 book entitled "Commodities Channel Index: Tools for Trading Cyclical Trends."
With this indicator, traders can trade at the right moment with optimal results. Momentum, aka timing, is one of the important things in trading.
Understanding How to Use the Commodity Channel Index (CCI)
Understand How the Commodity Channel Index Works
The Commodity Channel Index basically compares the relative position of the current price level with the average price over a certain period of time.
The CCI will be high enough when the price is well above its average, and it will be quite low when the price is well below the average.
As an indicator, if the CCI jumps towards +100, then it is described as a strong price movement and signals the start of an uptrend.
However, if the CCI falls below-100, then the price movement is described as being in a weak position and signals the start of a downtrend.
The CCI (Commodity Channel Index) indicator
 |
| Commodity Channel Index Indicator |
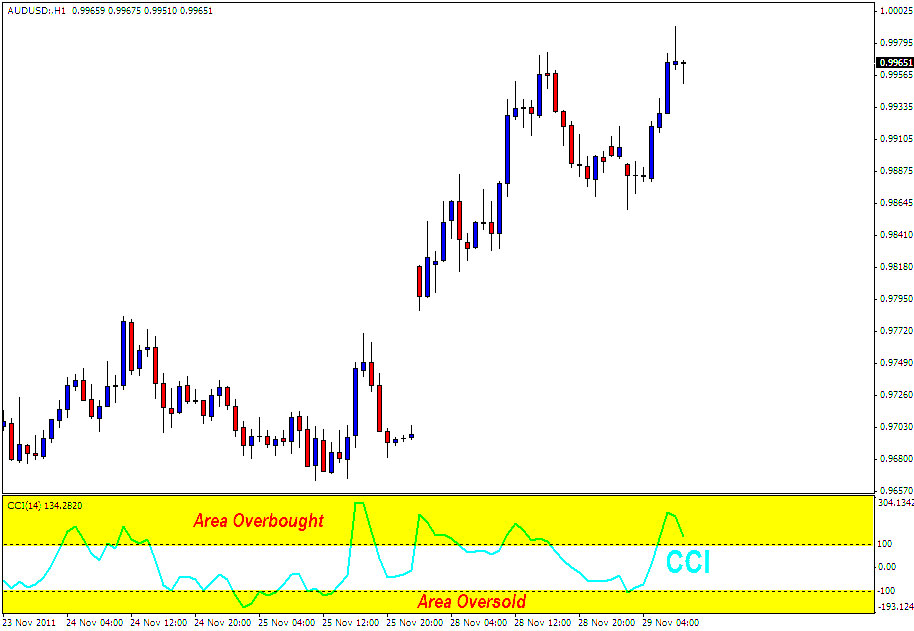
The image above shows the CCI indicator on the chart where there are three important components that you must understand.
- CCI line
- Overbought area (overbought)
- Oversold area (oversold)
Simply put, when the CCI line is pointing up, the market is in a bullish state (the price is rising). On the other hand, when the CCI line is pointing downwards, it means that the market is bearish (the price is falling). The steeper the slope of the CCI line, the stronger the bullish or bearish pressure.
A Comparison Between Overbought and Oversold
The difference between overbought and oversold
CCI can be used to identify overbought and oversold levels to determine when a price reversal occurs.
In this case, CCI can be used in forex analysis along with other oscillator-type technical indicators to monitor potential highs and lows, thereby providing clues about price changes that may occur in the future.
If translated into Indonesian, overbought means overbought. When CCI enters the overbought area, it can be estimated that the price is too high, so there is a possibility that the price will decrease. At CCI, this overbought area is above the 100 level and will be confirmed as a sell signal.
Sell Signals With The CCI Indicator
 |
Sell Signals With The CCI Indicator |
In contrast to overbought, oversold means oversold. So, when CCI enters the oversold area, it can be estimated that the price at that time was low enough that there was a possibility that the price would rise. At CCI, the oversold area is below the -100 level and will be confirmed as a buy signal.
 |
| Buy Signals With The CCI Indicator |
But keep in mind that a valid signal is a signal that is in the direction of the trend.
This means that sell signals are usually valid if they appear during a downtrend and buy signals are usually valid if they appear during an uptrend."
Indeed, sometimes signals that are in the opposite direction of the trend can also be used, but the results are not as good as signals that are in the direction of the trend.
Therefore, it is important for you to pay attention to the current trend in the market. Keep in mind that indicators are only to help you find the right moment.
Finding Different Types of Divergence
Recognize the Type of Divergence
In addition to providing oversold and overbought information, CCI can also be used in forex analysis to detect divergences, which are usually followed by price corrections.
Divergence is divided into 2 parts, namely:
- Bearish Divergence, and
- Bullish Divergence
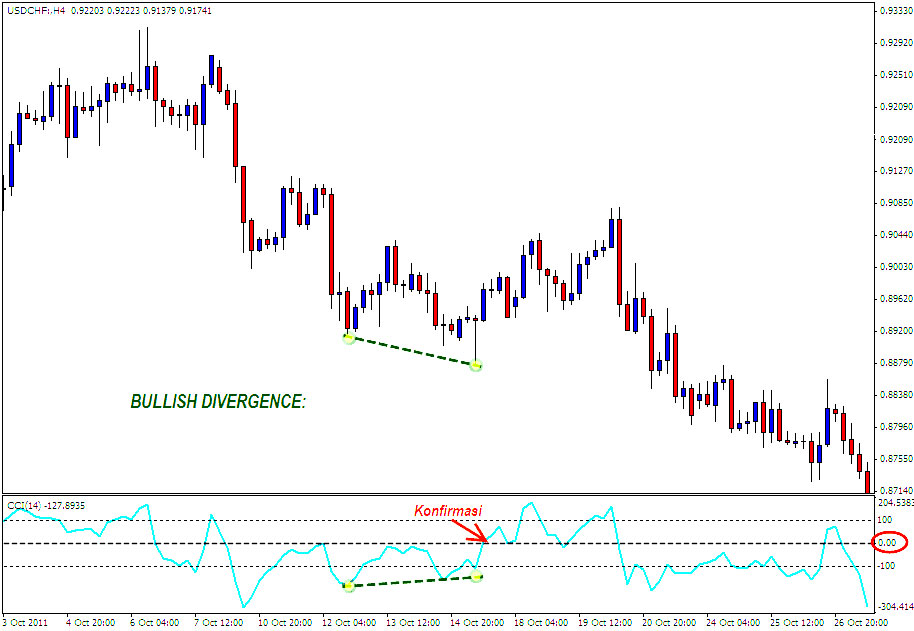
Bullish Divergence occurs when the price falls to form a new low, but the CCI moves up and forms a low from a higher position.
On the other hand, Bearish Divergence occurs when the price rises to a new high, but the CCI falls and forms a high at a lower position.
Bullish divergence usually marks the end of a downtrend and precedes a price reversal to the upside. On the other hand, Bearish Divergence marks the end of an uptrend and precedes a price reversal to the downside.
 |
| Bearish Divergence |
The easiest confirmation of bearish divergence is when the CCI line drops past the 0.00 level line. Candlestick patterns or formations can also be used as confirmation (to be studied at a further level).
However, keep in mind that bearish divergence usually tends to be followed by a downward correction, so the target of the movement will not be far away. In this case, the nearest trendline or support can be used as the farthest target of the movement.
 |
| Bullish Divergence |
On Bullish Divergence, confirmation occurs when the CCI line rises and crosses the 0.00 level line.
Like bearish divergence, bullish divergence is usually only followed by an upward correction. although it does not rule out that there will be a longer movement.
So, use divergence as an entry signal with caution!
Vital Records!
The CCI indicator has been used by technicalists for a long time. This, of course, proves that the CCI indicator is reliable enough to use.
The Commodity Channel Index can be used on various currency pairs and time-frames to complement your trading system. But keep in mind, it's good to use CCI with the help of other technical analysis.
Always remember, no indicator is perfect.
Therefore, it is important to be disciplined in studying the CCI indicators and other technical analysis that can be used in your trading.
Practice makes perfect.
Whenever you learn new strategies and indicators, always try to put them into practice. For that, you can use a demo account.
.jpg)

Post a Comment for " Commodity Channel Index Indicator (Complete Guide)"