Stochastic Oscillator Indicator History
Who is not familiar with stochastic?
 |
The Stochastic Oscillator can provide clues as to when it is the best time for a trader to buy or sell.
Although it does not offer 100% accuracy, of course, you can still improve the accuracy of these indicators by combining them with other indicators or combining them with proper money management.
Before discussing further this indicator, let's see a little history of the creation of this stochastic indicator!
The History of the Stochastic Oscillator
The Stochastic Oscillator was first developed in the 1950s by a doctor who was also a stock trader and technical analyst named George Lane.
Of course, this indicator was not created overnight. The creation of this indicator began when George Lane had difficulty reading such complex trading charts.
After he found out why and how prices move, George Lane started creating his own simple indicators to identify market trends.
George Lane has spent years studying market trends consistently and creating trading analysis that can make it easier for traders to determine when to enter and exit the market based on overbought and oversold conditions.
The results of these observations are then formulated and realized into a stochastic indicator, where this indicator can help traders generate profits quite well.
The Stochastic Oscillator and Its Applications
How to Use the Stochastic Oscillator?
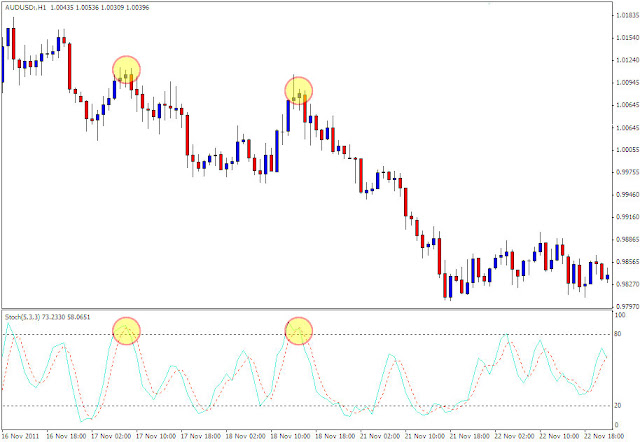
The main use of the stochastic indicator is to detect overbought and oversold conditions in trading.
On this indicator, you can see that there are two lines in the oscillator which are often referred to as the %K line for blue and the %D line for red, which is usually displayed as a dotted line as shown below!
Of course, the colors in this image can later be changed according to taste to make it easier for you to distinguish which ones are %K and which ones are %D.
Stochastic Difference Between Overbought and Oversold
Overbought and Oversold in Stochastic
Unlike Fibonacci, which can only work in downtrend or uptrend positions, stochastic can also work well when the market is in a sideways state.
Therefore, more accuracy is needed for you to translate buy and sell signals from Stochastic when the market is trending and use it as a reference as long as the signals that appear are in line with the ongoing trend.
So, during a downtrend, you can look for sell signals and vice versa, during an uptrend, you can look for buy signals.
 |
| Up Trend |
 |
| downtrend |
A simple way to use this indicator can be seen during an uptrend position, where you can buy and sell in a downtrend position.
Finding Divergence with Stochastic
In addition to functioning as overbought and oversold information, Stochastic can help traders find bullish and bearish divergences.
The tendency of prices to move up continuously over a set period of time is referred to as "bullish."
In forex trading, a bull market is often referred to as an uptrend, which will occur when the base currency in a currency pair experiences an increase in value. Usually, this condition occurs because of a country's economic fundamentals.
In contrast to bullish, bearish is the tendency of prices to move down continuously within a certain period of time.
This condition is often called a downtrend, which will occur when the base currency in a currency pair experiences a weakening in value.
How do you think this pattern works?
You can see the bullish divergence picture below by using the stochastic on the AUD/USD chart!
 |
| Bullish Divergence |
The workings of this pattern are similar to looking for divergence patterns on the CCI. Bullish divergence will get confirmation when the stochastic rises above the 50 level.
 |
| Bearish Divergence |
Unlike the bullish divergence, the bearish divergence seen on the AUD/USD chart above confirms this pattern when the stochastic drops past the 50 level.
Easy enough, right? The important thing that you need to have to use this indicator is to increase your practice by observing the stochastic.
Don't forget to test your skills on a demo account to improve your ability to use this indicator.


Post a Comment for " Stochastic Oscillator Indicator Usage Guide"