The term "support and resistance" (SNR) is fairly popular in the world of forex trading. It is one of the most frequently used techniques in technical analysis. Without it, traders will experience difficulties and even losses in carrying out trading activities.
Indeed, how much impact and benefit can traders experience with support or resistance? Then, how to apply and use it to maximize profit potential in forex trading?
It's time for you to find an easy way to determine support and resistance with simple indicators, which will be explained in full below.
Learn about forex support and resistance.
What is support and resistance?
In simple terms, support and resistance are likened to the two attributes that are most widely discussed in the analysis, where support is a level that has the potential to withstand price declines. Meanwhile, resistance is a level area that has the potential to hold back price increases. These levels are used to determine whether the price will continue or reverse direction.
Basically, support and resistance aim to find the right area when taking a buy or sell position and determine the target of price movement.
The support area is generally an area that is used as a reference to find buy positions, while the resistance area is used as a reference to find short positions.
Differences in the Focus of Support and Resistance
Basically, SNR aims to find the right area when taking a buy or sell position and determine the target of the price movement.
The support area is generally an area that is used as a reference to find buy positions, while the resistance area is used as a reference to find short positions.
Support
- Levels that have the potential to withstand price declines.
- As a starting point for locating buy positions
Resistance
- levels that have the potential to withstand price increases.
- As a starting point for locating short positions
Therefore, support and resistance can be combined in the form of a candlestick, which is believed to determine the next movement.
Support Principle
Economic support can be interpreted as a level where supply begins to decrease and demand increases so that if this happens, prices will rise at that level.
In principle, if the market price manages to penetrate the support level, it is estimated that the market price will continue its decline until the next support level.
However, if the market price is unable to penetrate that level, it is certain that the market price will reverse direction. The support level that has been broken can become a resistance level and pressure the market price to keep going up.
Resistance Principle
Meanwhile, economic resistance can be interpreted as a level where supply exceeds the maximum limit and demand has begun to decrease, so market prices will fall at that level.
If the market price manages to rise and penetrate the resistance level, it is estimated that the market price will continue to rise to the next level. The level that has been broken will become support and can hold the market down past that level.
The Concept of Support and Resistance in Daily Life
Basically, the concepts of support and resistance are often used in everyday life. As an example,
First Example
You know the price of an item that is sold daily for $1,000? But one day, the price of the item dropped to $800.
The next day, the price rose again to $1,000. Then you will think at that time that the price of $800 is the best price you can get.
Here we can learn that the price of $800 becomes a support point that keeps the price from falling again because, psychologically, this price is quite attractive to many people.
Second Example:
You are a chili trader, where the price of chili can rise at a certain price level. But the price failed to rise to $800.
This is due to insufficient market power so that the price of chili will not increase. You will think that the price of $800 is the best price for you to sell your stock of goods.
Therefore, the price of $800 becomes a resistance point that prevents the price from rising because, psychologically, many want to sell at that price.
Resistance is considered the'sky' because this price level prevents the market from moving the price up.
Although we often encounter it in everyday life, the fact is that support and resistance are quite important for you to learn in forex trading.
You have to learn to observe and read forex charts well -- because if you don't, it's certain that you will have difficulty trading.
How to determine the correct support and resistance?
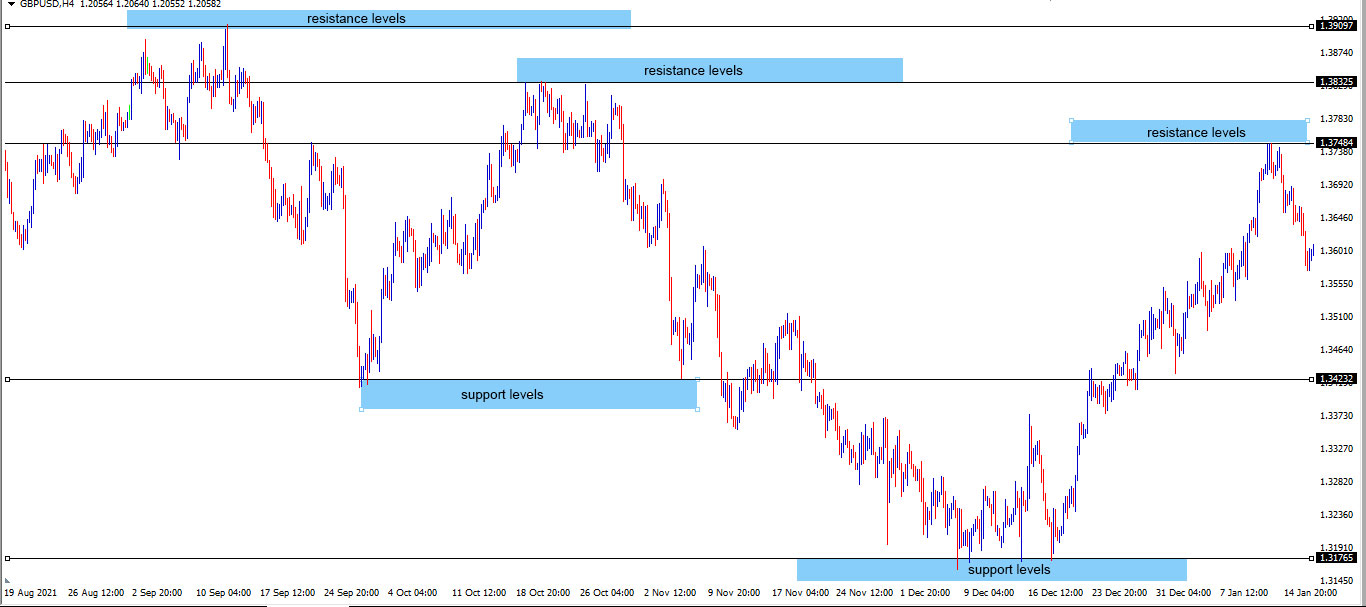
1. The highest point (top) or the lowest point (bottom)
This method is a simple way to determine support and resistance by looking at historical data where prices have held. For more details, you can look at the following picture:
The image above shows the price movement using a candlestick. A candlestick is a method for charting and reading the price movement of stocks, commodities, and forex.
The larger the time frame used, the greater the validity of the support and resistance. Using this method can help you see where the price is holding a lot.
Learn how to determine the highest and lowest points on a demo account with a virtual capital of up to $500,000.
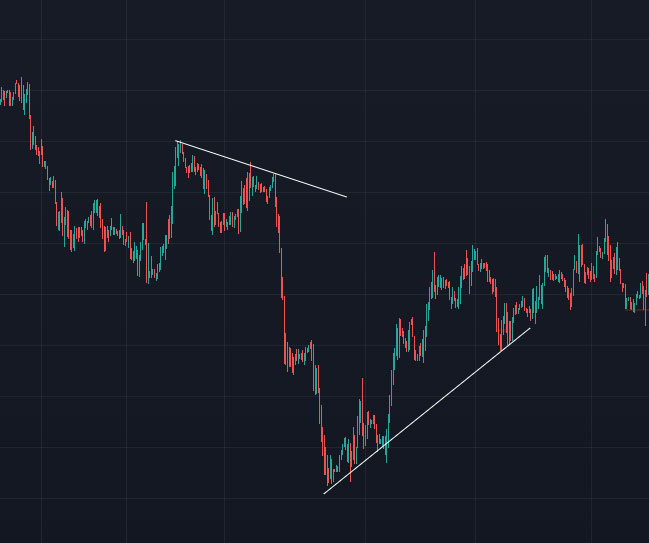
2. Trendline
Trendline is one method that can be used as both support and resistance.
To be able to draw a trendline well, you must identify the trend first by combining at least two valley points during an uptrend and at least two peak points during an uptrend.
If the price approaches the trendline, then the opportunity area can be opened to become a resistance or support area as shown below.
 |
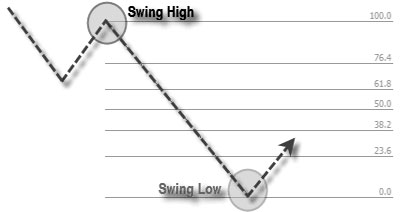
3. Retracement of the Fibonacci sequence
Did you know that Fibonacci retracement is a forex analysis tool that is quite widely relied on by traders and can act as support and resistance?
Fibonacci is almost always in forex trading tools because it is considered the main analysis tool or just an addition for novice or experienced traders.
If you have enough experience using Metatrader, the Fibonacci retracement tool may sound familiar to you. For those of you who are new to Metatrader, you can download the guide here.
Fibonacci has levels that are commonly used, namely:
0.0% level
Level 23.6%
Level 38.2%
Level 50.0%
Level 61.8%
Level 76.4%
Level 100.0%
Fibonacci Retracement Levels.
These levels are often used as a reference to determine areas of support and resistance. Therefore, you can take some popular levels that are usually used as a reference to determine support and resistance, namely 38.2%, 50.0%, and 61.8%.
That said, at these levels, traders believe that buy or sell signals often appear with high accuracy, as shown below.
What are round numbers? A round number is a level that is a round number and is quite easy to remember. The example is:
With a psychological level of 100 in USD/JPY,
EUR/USD is trading at 1.30000 or 1.40000.
AUD/USD at the psychological mark of 1.0000, etc.
In forex trading, there are various ways to determine areas of support and resistance on a forex chart, and one of the most interesting studies is "psychology in round numbers".
According to this strategy, the rounder the price numbers on the chart, the stronger the price position is to be used as support or resistance.
5. Pivot Points
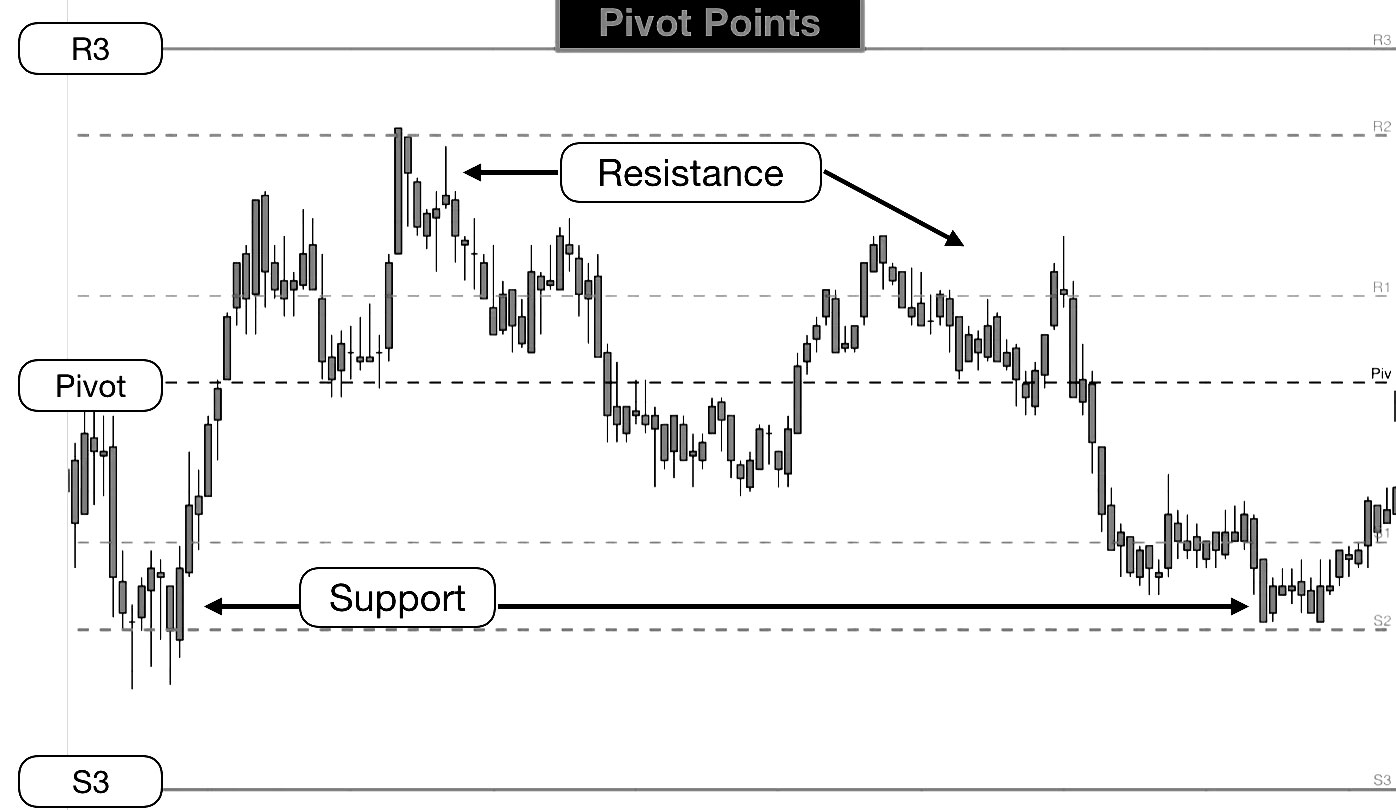
Pivot points are not indicators but a branch of technical analysis that is used as a counter to determine areas of support and resistance. Traders usually refer to pivot points as objective support and resistance.
Pivot points are made based on the highest price (high), lowest price (low), and closing price (close) in the previous period, to generate estimates of support and resistance levels for future price movements.
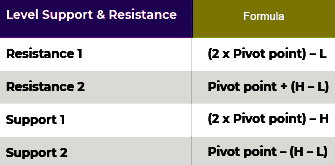
This level is calculated by the following formula:
(H + L + C) Pivot = 3
However, there are also those who add high, low, and close prices for the previous period, with the addition of the current open period, with the following calculation:
(O1 + H + L + C) = 4 Pivot
Another variation can be made by adding weights that are considered important, such as emphasizing market closing.
(H + L + C +) = 4 Pivot
Basically, the use of pivot points tends to coincide with the use of layered support and resistance, even several times.
To determine support and resistance levels, you can use the following formula:
The use of pivot points is the same as the use of support and resistance in general. When the market price approaches support, it is likely that the price will reverse back up. However, if the market price breaks through, the bearish pressure will continue towards the next support, and vice versa.
6. Moving Averages
Moving averages are often called dynamic support and resistance (dynamic support and resistance). Because this method moves according to price movements,
Moving averages are trend-following and delayed because they are based on past prices. During an uptrend, the moving average serves as support. However, during a downtrend, the moving average can function as resistance.
Therefore, many traders use this method as a technical analysis tool because it has the simplest and easiest indicators to use.
 |
| Moving Average Periode 50, 200. Mt4 |
Important to note!
Although there are many methods that can be used to determine support and resistance levels in the market, without regular practice, a trader will not be able to place support and resistance points properly and correctly.
For those of you who are still beginners, make sure you continue to do a lot of analysis, practice, and try to practice through a demo account so that your abilities can continue to grow. Understanding the trend remains the main thing that you must have.
Furthermore, for traders who are still learning about forex trading, try to keep the price in an uptrend if you want to take a buy position with reference to the support area.
However, if you want to open a sell position, make sure the price is in a downtrend with resistance as the price reference. Placement of stop loss (SL) and take profit (TP) can also take advantage of support and resistance.
For example, for a long position, you can place the SL below the support and the TP below the nearest resistance. On the other hand, for short positions, place the SL above the resistance and the TP above the nearest support.





Post a Comment for "Easy tips : how to find support and resistance levels"